Introduction
Sentiment analysis refers to identifying and classifying the sentiments that are expressed in the text source. Tweets are often useful in generating a vast amount of sentiment data upon analysis. These data are useful in understanding the opinions of people about a variety of topics.
In this article, we aim to analyze Twitter sentiment analysis using machine learning, the sentiment of the tweets provided from the Sentiment140 dataset by developing a machine learning pipeline involving the use of three classifiers (Logistic Regression, Bernoulli Naive Bayes, and SVM)along with using Term Frequency- Inverse Document Frequency (TF-IDF). The performance of these classifiers is then evaluated using accuracy and F1 Scores.
Twitter allows businesses to engage personally with consumers. However, there’s so much data on Twitter that it can be hard for brands to prioritize which tweets or mentions to respond to first. That’s why sentiment analysis has become a key instrument in social media marketing strategies.
Import Necessary Dependencies
import numpy as np
import pandas as pd
import re
import matplotlib.pyplot as plt
import seaborn as sns
import word cloud
from word cloud import WordCloud
Read and Load the Dataset
train = pd.read_csv('train.csv').drop(columns = ['id'])
test = pd.read_csv('test.csv').drop(columns = ['id'])
Exploratory Data Analysis
a=train.shape[0]
b=sum(train['label']==1)
print(a)
print(b)
print("Percentage of tweets labeled as a negative sentiment:",end='')
print(100*b/a)


a=train.shape[0]
b=sum(train['label']==0)
print(a)
print(b)
print("Percentage of tweets labeled as a positive sentiment:",end='')
print(100*b/a)
Data Visualization
ax = train['label'].value_counts().plot(kind='bar', figsize=(8,8),xlabel="Sentiment ( 0 == positive, 1 == negative)",ylabel="Count" ,title="Distribution of positive and negative sentiments in the data")
Output
import matplotlib.pyplot as plt
def createPieChartFor(t_df):
    Lst = 100*t_df.value_counts()/len(t_df)

    labels = t_df.value_counts().index.values
    sizes =  Lst

    fig1, ax1 = plt.subplots()
    ax1.pie(sizes, labels=labels, autopct='%1.2f%%', shadow=True, startangle=90)
    ax1.axis(''equal')
    plt.show()
Output
import wordcloud
from wordcloud import WordCloud
allWords = ' '.join([twts for twts in train['tweet']])
wordCloud = WordCloud(width=500, height=300, random_state=21, max_font_size=110).generate(allWords)


plt.figure(figsize = (10, 8))
plt.imshow(wordCloud, interpolation="bilinear")
plt.axis('off')
plt.show()
train.info()
np.sum(train.isnull().any(axis=1))
import matplotlib.pyplot as plt
def histogram_plot(db, title):
    plt.figure(figsize=(8, 6))

    ax = plt.subplot()
    ax.spines["top"].set_visible(False)
    ax.spines["bottom"].set_visible(False)
    ax.spines["right"].set_visible(False)
    ax.spines["left"].set_visible(False)

    ax.get_xaxis().tick_bottom()
    ax.get_yaxis().tick_left()

    plt.title(title, fontsize = 22)
    plt.hist(db, edgecolor='black', linewidth=1.2)
    plt.show()


histogram_plot(train['label'], title = "Label distribution")
plt.show()
Data Preprocessing
- Remove Punctuations
import string
english_punctuations = string.punctuation
punctuations_list = english_punctuations
def cleaning_punctuations(text):
    translator = str.maketrans('', '', punctuations_list)
    return text.translate(translator)
train['tweet']= train['tweet'].apply(lambda x: cleaning_punctuations(x))
test['tweet']= test['tweet'].apply(lambda x: cleaning_punctuations(x))


train['tweet'].tail()
2. Remove Repeating characters
def cleaning_repeating_char(text):
    return re.sub(r'(.)1+', r'1', text)
train['tweet'] = train['tweet'].apply(lambda x: cleaning_repeating_char(x))
test['tweet'] = test['tweet'].apply(lambda x: cleaning_repeating_char(x))
train['tweet'].tail()
3. Remove URLs
def cleaning_URLs(data):
    return re.sub('((www.[^s]+)|(https?://[^s]+))',' ',data)
train['tweet'] = train['tweet'].apply(lambda x: cleaning_URLs(x))
test['tweet'] = test['tweet'].apply(lambda x: cleaning_URLs(x))
train['tweet'].tail()
4. Remove numbers
def cleaning_numbers(data):
    return re.sub('[0-9]+', '', data)
train['tweet'] = train['tweet'].apply(lambda x: cleaning_numbers(x))
test['tweet'] = test['tweet'].apply(lambda x: cleaning_numbers(x))
train['tweet'].tail()
5. Tokenization
from nltk.tokenize import RegexpTokenizer
tokenizer = RegexpTokenizer(r'w+')
train['tweet'] = train['tweet'].apply(tokenizer.tokenize)
test['tweet'] = test['tweet'].apply(tokenizer.tokenize)


train['tweet'].head()
6. Removing Stop words
from nltk.tokenize import RegexpTokenizer
tokenizer = RegexpTokenizer(r'w+')
train['tweet'] = train['tweet'].apply(tokenizer.tokenize)
test['tweet'] = test['tweet'].apply(tokenizer.tokenize)
train['tweet'].head()
7. Stemming
import nltk
st = nltk.PorterStemmer()
def stemming_on_text(data):
    text = [st.stem(word) for word in data]
    return data
train['tweet']= train['tweet'].apply(lambda x: stemming_on_text(x))
test['tweet']= test['tweet'].apply(lambda x: stemming_on_text(x))
train['tweet'].head()
8. Lemmatization
lm = nltk.WordNetLemmatizer()
def lemmatizer_on_text(data):
    text = [lm.lemmatize(word) for word in data]
    return data
train['tweet'] = train['tweet'].apply(lambda x: lemmatizer_on_text(x))
test['tweet'] = test['tweet'].apply(lambda x: lemmatizer_on_text(x))
train['tweet'].head()
Splitting the data into train and test set
# Separating the 95% data for training data and 5% for testing data
X_train, X_test, y_train, y_test = train_test_split(X,y,test_size = 0.05, random_state =26105111)
vectoriser = TfidfVectorizer(ngram_range=(1,2), max_features=500000)
vectoriser.fit(X_train)
print('No. of feature_words: ', len(vectoriser.get_feature_names_out()))
X_train = vectoriser.transform(X_train)
X_test  = vectoriser.transform(X_test)
def model_Evaluate(model):
# Predict values for Test dataset
  y_pred = model.predict(X_test)
# Print the evaluation metrics for the dataset.
  print(classification_report(y_test, y_pred))
# Compute and plot the Confusion matrix
  cf_matrix = confusion_matrix(y_test, y_pred)
  categories = ['Negative','Positive']
  group_names = ['True Neg','False Pos', 'False Neg','True Pos']
  group_percentages = ['{0:.2%}'.format(value) for value in cf_matrix.flatten() / np.sum(cf_matrix)]
  labels = [f'{v1}n{v2}' for v1, v2 in zip(group_names,group_percentages)]
  labels = np.asarray(labels).reshape(2,2)
  sns.heatmap(cf_matrix, annot = labels, cmap = 'Blues',fmt = '',
  xticklabels = categories, yticklabels = categories)
  plt.xlabel("Predicted values", fontdict = {'size':14}, labelpad = 10)
  plt.ylabel("Actual values" , fontdict = {'size':14}, labelpad = 10)
  plt.title ("Confusion Matrix", fontdict = {'size':18}, pad = 20)
Model Evaluation
- BernoulliNB
BNBmodel = BernoulliNB()
BNBmodel.fit(X_train, y_train)
model_Evaluate(BNBmodel)
y_pred1 = BNBmodel.predict(X_test)
from sklearn.metrics import roc_curve, auc
fpr, tpr, thresholds = roc_curve(y_test, y_pred1)
roc_auc = auc(fpr, tpr)
plt.figure()
plt.plot(fpr, tpr, color='darkorange', lw=1, label='ROC curve (area = %0.2f)' % roc_auc)
plt.xlim([0.0, 1.0])
plt.ylim([0.0, 1.05])
plt.xlabel('False Positive Rate')
plt.ylabel('True Positive Rate')
plt.title('ROC CURVE')
plt.legend(loc="lower right")
plt.show()
2. SVC Model
SVCmodel = LinearSVC()
SVCmodel.fit(X_train, y_train)
model_Evaluate(SVCmodel)
y_pred2 = SVCmodel.predict(X_test)
from sklearn.metrics import roc_curve, auc
fpr, tpr, thresholds = roc_curve(y_test, y_pred2)
roc_auc = auc(fpr, tpr)
plt.figure()
plt.plot(fpr, tpr, color='darkorange', lw=1, label='ROC curve (area = %0.2f)' % roc_auc)
plt.xlim([0.0, 1.0])
plt.ylim([0.0, 1.05])
plt.xlabel('False Positive Rate')
plt.ylabel('True Positive Rate')
plt.title('ROC CURVE')
plt.legend(loc="lower right")
plt.show()
3. Logistic Regression
LRmodel = LogisticRegression(C = 2, max_iter = 1000, n_jobs=-1)
LRmodel.fit(X_train, y_train)
model_Evaluate(LRmodel)
y_pred3 = LRmodel.predict(X_test)
from sklearn.metrics import roc_curve, auc
fpr, tpr, thresholds = roc_curve(y_test, y_pred3)
roc_auc = auc(fpr, tpr)
plt.figure()
plt.plot(fpr, tpr, color='darkorange', lw=1, label='ROC curve (area = %0.2f)' % roc_auc)
plt.xlim([0.0, 1.0])
plt.ylim([0.0, 1.05])
plt.xlabel('False Positive Rate')
plt.ylabel('True Positive Rate')
plt.title('ROC CURVE')
plt.legend(loc="lower right")
plt.show()
Conclusion
Upon evaluating all the models we can conclude the following details i.e.
Accuracy: As far as the accuracy of the model is concerned Logistic Regression performs better than SVM which in turn performs better than Bernoulli Naive Bayes.
F1-score: The F1 Scores for class 0 and class 1 are :
(a) For class 0: Bernoulli Naive Bayes(accuracy = 0.90) < SVM (accuracy =0.91) < Logistic Regression (accuracy = 0.92)
(b) For class 1: Bernoulli Naive Bayes (accuracy = 0.66) < SVM (accuracy = 0.68) < Logistic Regression (accuracy = 0.69)
AUC Score: All three models have the same ROC-AUC score.
We, therefore, conclude that the Logistic Regression is the best model for the above-given dataset.
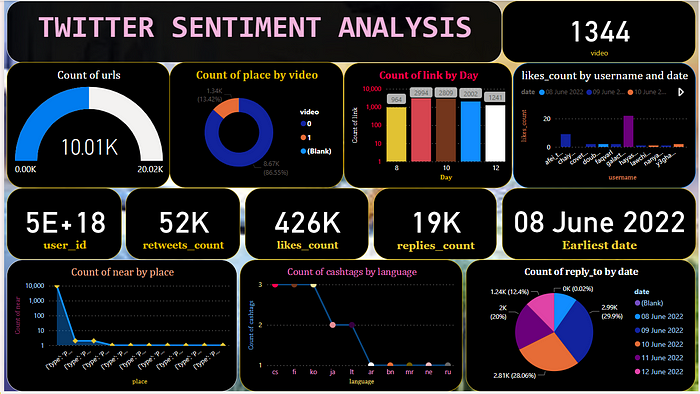
PowerBI

